Regulation 18 draft Local Plan
(10) Chapter 2 – Spatial Portrait
Spatial Portrait
The spatial portrait provides context for the spatial vision and strategic objectives. It sets out the main characteristics of Rutland in terms of geography, environment, demographics, economy and infrastructure as well as social and cultural matters.
Spatial Characteristics
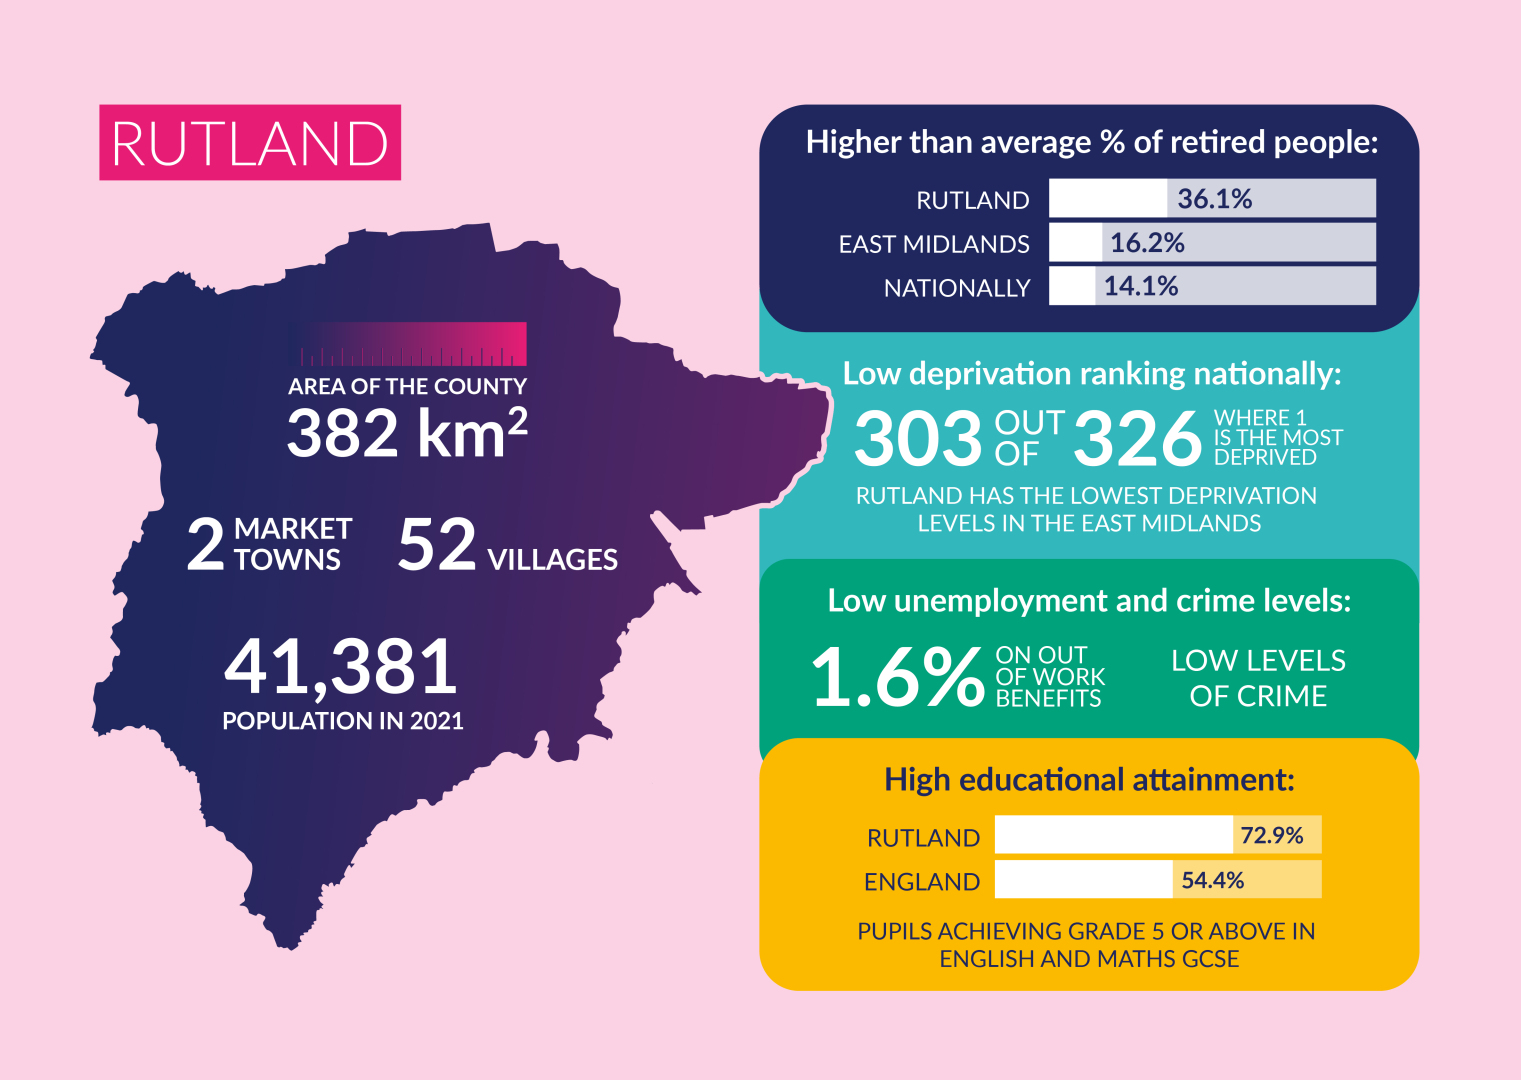
The area of Rutland is approximately 382 km2 and latest data indicates that in 2021 the population was 41,381[1]. This is projected to rise to 45,038 by 2036 and to 46,100 by 2041[2]. The density of population is low with 108 people per km2[3] Rutland has been classed as the most rural county or unitary authority in England and Wales with a high proportion of land in agricultural use.
Rutland is home to two market towns – Oakham and Uppingham - of which Oakham is the larger with a population of approximately 11,227.[4] Oakham has a range of education, community, health and leisure facilities. It is also a centre for employment and shopping, including a twice-weekly market and a mix of independent and country wide retailers. Uppingham has a population of about 5001[5] with a more limited range of facilities, employment and shopping, and a weekly market.
Rutland also has 52 villages ranging in size from small hamlets with a few houses and no facilities to larger villages with facilities such as a school, a convenience store, a post office, general medical practice, employment opportunities, community and leisure facilities and bus links to the towns and neighbouring villages. The six largest villages account for around a quarter of Rutland's population.
Beyond Rutland's borders, Stamford lies just outside the County boundary to the east. It provides a range of community and leisure facilities, shopping, education, health services and acts as a service centre to some of the villages on the eastern side of Rutland. Stamford is tightly constrained by the County boundary and has limited space to grow. Corby lies approximately three miles south of Rutland and Melton Mowbray lies approximately five miles north-west.
Environment
Rutland has a rich built and historic environment with many attractive stone-built villages and two historic town centres that provide a distinctive local character to the area. There are 34 designated conservation areas and approximately 1,650 listed buildings that are afforded statutory protection. The County has approximately 30 scheduled ancient monuments and two registered historic parks and gardens (Exton and Burley).
The environmental quality of Rutland's landscape is high, and the character of the landscape is varied with five different landscape character types. These range from high plateau landscapes across large areas of the north-east and south-west to lowland valleys in the centre and north-west and on the County's southern border along Welland Valley.
Rutland has 19 sites of special scientific interest (SSSIs) including Rutland Water which is an internationally designated wetland site with importance for wintering and passage wildfowl. There are 359 local wildlife sites (LWS) and important areas of calcareous grassland and ancient and broadleaved woodland in the County.
The limestone geology has importance for local quarrying and wildlife. Soils are largely loamy in the east and clayey in the west[6]. Agricultural land is largely grade 3 with some grade 2 centred on the south and pockets of grade 1 in the north.
Sustainable and Vibrant Communities
Rutland is a relatively affluent area with very low levels of deprivation, the lowest in the East Midlands and 303 out of 326 nationally, where 1 is the most deprived[7]. There are low levels of unemployment (1.6% on out of work benefits in February 2023)[8] and very low levels of crime.
Educational attainment within Rutland is higher than the country as a whole with 72.9% of pupils attaining grade 5 or above in English and mathematics GCSEs compared to 54.4% in England.[9]. Rutland has 17 primary schools located in the towns and larger villages and three secondary schools located in Oakham, Uppingham and Great Casterton. There are also large independent schools in Oakham and Uppingham.
The 2021 Census found that 86.2% of people in Rutland were in good or very good health. Rutland has a higher proportion than the East Midlands regional average of people in good health and lower levels of limiting long-term illness[10]. The County has a hospital in Oakham which provides inpatient and outpatient services. Rutland is also served by larger hospitals in Leicester, Peterborough, Grantham and Kettering. GP and dentists' practices are located in Oakham and Uppingham and some of the villages.
There are below average numbers of people in the 0-9 and 20-24 age groups (particularly females) and above average in the 15-19 and 55-90 compared with the East Midlands regional and national averages. The numbers of 15-19 are increased within Rutland due to the presence of 2 boarding schools within the County. 36.1% of the population of Rutland is retired, compared with 16.2% within the East Midlands and 14.1% nationally[11]. By 2041 it is anticipated that approximately 39% of our residents will be 60 or over, with the percentage of residents aged 80 or over rising by a third during the life of the plan from 7.5% to 11.3%[12]. The 2021 Census found the proportion of non-white ethnic groups is low at 5%, but that this has risen by around 2% since 2011[13].
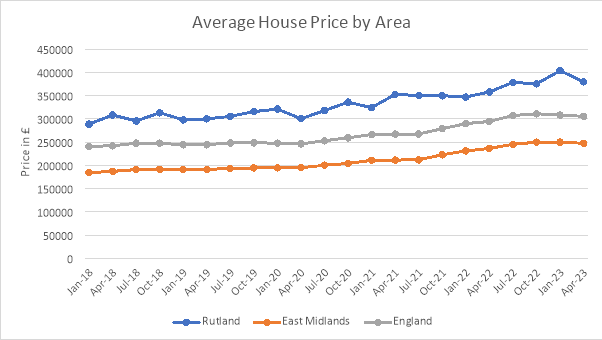
Figure 1 Average House Price by Area
(Source: UK House Price Index April 2023)
Rutland has a high proportion of detached and very large houses and properties owned outright compared with the rest of the region and a lower proportion of mortgaged properties and rented properties.
The average house price in Rutland in April 2023 was £380,047 compared with the East Midlands regional average of £247,634 and £305,731 for the whole of England.[14] This is partly a reflection of the number of large houses within Rutland. It is one of the least affordable areas in the region with median house price to median workplace earnings ratio of 9.12 in 2022 compared with 7.45 across the East Midlands[15].
Economy
The largest employment sectors in Rutland are education (12.2%), public administration & defence (12%) and wholesale & retail (11.6%). Agriculture, the traditional employer, is a minority employer and still declining.
Major employers with importance to the local economy include the Ministry of Defence establishments at Cottesmore and North Luffenham (although this site is due to close by 2026) and HM Prison at Stocken, independent schools at Oakham and Uppingham, Hanson Cement at Ketton and Rutland County Council in Oakham. Small businesses also have a key role. Oakham Enterprise Park provides office, storage, light industrial and amenity/leisure accommodation on the 25-acre site formerly occupied by HM Prison Ashwell. The King Centre at Barleythorpe, formerly Rutland County College, provides serviced accommodation to around 30 businesses.
Rutland compares well within the region on a range of economic activity indicators as shown in Table 1. Economic activity rates for both men and women are around 5% above the East Midlands and national averages with very low levels of unemployment. Self-employment levels are slightly higher than the regional and national averages. A high proportion of the resident work force is managerial or professional (52.4%). Average resident earnings are higher than both regionally and nationally and this is replicated in the percentages for average male earnings. However, female average earnings fall below both regional and national averages.[16]
Table 3: Economic Activity indicator statistics (16–64-year-olds)[17]
|
Indicator |
Rutland |
East Midlands |
Great Britain |
|
Economic activity levels (Oct 2021- Sep 2022) |
83.2% |
77.8% |
78.4 |
|
Unemployment levels (Oct 2021- Sep 2022) |
2.1% |
3.0% |
3.7% |
|
Self-employment for men and women (Oct 2021 – Sep 2022) |
10.1% |
8.3% |
9.2% |
|
Average Resident Earnings 2022 (Gross weekly pay of full-time workers) |
£683.00 |
£603.70 |
642.20 |
|
Average Male Resident Earnings 2022 (Gross weekly pay of full-time workers) |
£792.10 |
£648.90 |
£687.50 |
|
Average Female Resident Earnings 2022 (Gross weekly pay of full-time workers) |
£517.10 |
£536.60 |
£584.50 |
Infrastructure and Travel
The A1 passes through the eastern part of Rutland providing north-south road links. East-west connections are less good, although the A47, which traverses the southern part of Rutland, and the A606 Stamford-Nottingham Road including the Oakham bypass, provide east-west road links. The A6003 connects Oakham to Corby.
Oakham has a railway station which serves the Birmingham to Peterborough line with direct rail links to the east coast main line and Stansted airport to the east and Birmingham to the west. It also has a direct once-daily return rail link to London via Corby. Oakham also has a bus station with scheduled services to the surrounding area as well as a CallConnect on-demand bus service.
As a rural community, many of Rutland's residents rely on a private car to access services and facilities available within the towns and larger villages. Car ownership within Rutland is higher than the regional average – with only 10.3% of Rutland households not having access to a car or van, compared to 19.1% of households in the East Midlands.[18]
Rutland is served by a network of public footpaths, but these do not provide links between all the rural communities within the County. There are also a number of long-distance footpaths which pass through Rutland including the Viking Way to the east, the Leicestershire Border Walk to the west and the 65-mile Rutland Round which takes a circular route around the County boundaries.
Waste Management
All forms of development and activities produce waste, this includes residential, commercial, industrial, agricultural, and construction. It is estimated that Rutland currently produces around 90,000 tonnes of waste per annum. This includes municipal (24%), commercial and industrial (23%), construction, demolition and excavation (53%) and hazardous (1%) wastes.
The majority of Rutland's waste is exported to surrounding counties where it is recycled, composted, treated, or disposed of to landfill. Since 2014, around 40% of municipal waste has been diverted from landfill to an advanced treatment facility in Nottingham for recovery. Rutland is served by two civic amenity sites located just outside Cottesmore and North Luffenham.
Geology and Minerals
The particular geology of the area has given its name to the Rutland Formation which was formed from muds and sand carried down by rivers and occurring as bands of different colours, each with many fossil shells at the bottom. At the bottom of the Rutland Formation is a bed of dirty white sandy silt. Under the Rutland Formation is a formation called the Lincolnshire Limestone. The best exposure of this limestone (and also the Rutland Formation) is the area near to Ketton.
Mineral resources are concentrated almost exclusively in the eastern half of the County and consist mainly of limestone and clay. Some isolated pockets of sand and gravel deposits exist around the edge of the County particularly in the Welland Valley to the south and east of the County. Smaller pockets are found around the River Eye and Whissendine Brook in the north-west, Eye Brook in the west and River Gwash in the north-east.
Within Rutland, both aggregate and non-aggregate minerals are produced. Specific to Rutland this includes limestone as crushed rock (aggregate minerals) and limestone for the purpose of cement manufacture, building / roofing stone and agricultural lime as well as clay for the purpose of brick making and cement manufacture (non-aggregate minerals). Limestone and clay have historically been the main minerals worked in Rutland; this is likely to continue. Ironstone was extracted in the past, but operations ceased in the 1970's and there is no evidence that sand and gravel reserves have ever been worked.
A limited amount of recycled aggregate (from construction, demolition and excavation waste) is currently produced in Rutland within Woolfox quarry. There are currently no facilities within the County for the production of secondary aggregates.
Development in Neighbouring Areas
Proposals for new housing and employment growth in neighbouring areas may impact on the demand for housing, employment and recreation facilities in Rutland. Of particular relevance are proposals for housing growth in Leicestershire (in Melton Borough and Harborough Borough); South Kesteven District; Peterborough City; Corby and East Northamptonshire (see Figure 2 below). The effects of development in neighbouring areas can be difficult to predict and will depend on:
- the success of surrounding areas in creating the required number of jobs and the type of jobs that are created
- the price of market housing in neighbouring areas other expansion areas; and
- the policy of housing authorities in neighbouring areas towards affordable housing in general and, in particular, social housing for people of working age because this will affect labour supply.
Figure 2: Scale of proposed new housing in local plans for neighbouring areas
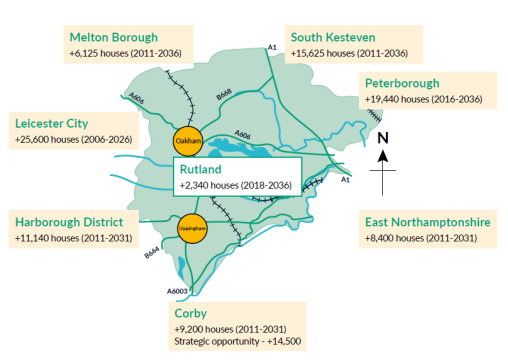
Source: Local Plans and Local Development Documents of neighbouring authorities
Duty to Co-operate
The Rutland Local Plan considers the implications of planning policies of neighbouring authorities as spatial planning should not be constrained by local authority administrative boundaries. The County Council has engaged with neighbouring authorities at all stages in the preparation of the Plan and will continue to do so as necessary and in particular on strategic cross boundary matters.
As a local planning authority, the Council has a statutory "duty to co-operate" with neighbouring authorities. We will continue to work together to ensure that all strategic and cross boundary issues arising from this Local Plan review are appropriately considered. The NPPF (paragraph 27) sets out that: "in order to demonstrate effective and on-going joint working, strategic policy-making authorities should prepare and maintain one or more statements of common ground, documenting the cross-boundary matters being addressed and progress in cooperating to address these."
[1] Office for National Statistics (2023) Mid-2021 Estimates of the population for the UK, England, Wales, Scotland and Northern Ireland, Accessed: April 2023
[2] Office for National Statistics (2023) Population projections for local authorities: Table 2, Accessed: April 2023
[3] Office for National Statistics(2023) Mid-2021 Estimates of the population for the UK, England, Wales, Scotland and Northern Ireland, Accessed: April 2023
[4] Office for National Statistics (2023) Population Estimates for 2020 Wards in England and Wales by Single Year of Age and Sex - Experimental Statistics, Accessed: April 2023
[5] Ibid.
[7] Ministry of Housing, Communities and Local Government (2019), English Indices of Deprivation 2019 – File 10 Local Authority district summaries, Accessed: April 2023
[8] Office for National Statistics via NOMIS (2023) Claimant count by sex - not seasonally adjusted. Accessed: April 2023
[10]Office for National Statistics 2021 Census: How general health (age-standardised) varied across local authorities in England and Wales, 2021, Accessed: April 2023
[11] Office For National Statistics via NOMIS (2023). Nomis Economic Inactivity in Rutland Oct 21- Sep 22. Accessed: April 2023
[12] Office of National Statistics (2023), 2018-based Subnational Population Projections for Local Authorities and Higher Administrative Areas in England. Accessed: April 2023
[13] Office for National Statistics(2023) How life has changed in Rutland: Census 2021 Accessed April 2023.
[14] UK House Price Index (2023) Average price of property in Rutland Accessed: April 2023
[15] Office for National Statistics via NOMIS (2023) Ratio of median house price to median workplace-based earnings by Local Authority District (1997 to 2022). Accessed: April 2023
[16] Office for National Statistics via NOMIS (2023) Nomis Labour Market Profile – Rutland 2021-2022. Accessed: April 2023
[17] Ibid
[18] Office for National Statistics via NOMIS (2021) Car and van ownership. Accessed April 2023