Planning for Rutland’s Future - Issues and Options Consultation
Issue 2a: Determining the appropriate level of housing growth
Strategic Objective 2: Delivering sustainable development by determining an appropriate level and location of growth in Rutland, sited in locations where people can access jobs and services, and in delivering wider social and economic outcomes, taking account of environmental considerations.
The NPPF states that: "To determine the minimum number of homes needed, strategic policies should be informed by a local housing need assessment, conducted using the standard method in national planning guidance – unless exceptional circumstances justify an alternative approach which also reflects current and future demographic trends and market signals". The standard methodology uses population projections as the base for its calculation. Over the period 2021-2041 the population of the County is expected to change by 13%
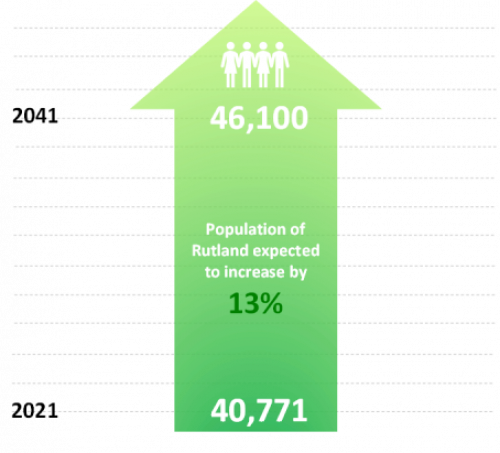
Infographic showing the expected rise in population in the county over the period 2021 to 2041
The latest (March 2022) calculation of the Local Housing Need (LHN) for Rutland is 142 dwellings per annum, which normally would be round to 140 dwellings per annum. This is the minimum number of houses the Council can use as the basis of preparing the Local Plan. On top of this, it is expected that Local Plans provide a "contingency buffer" to the minimum requirement. This "buffer" is different from that which is prescribed in the NPPF for the calculation of the five-year housing supply. Inspectors will generally expect a buffer of at least 10%. A figure less than this would require exceptional circumstances for its justification. Buffers in examined Local Plans have been as high as 69%.
The 2019 Strategic Housing Market Assessment (SHMA) for Rutland could provide an alternative approach to determining the minimum number of homes needed. This would take account of current and future demographic trends a well as market signals and provides a detailed assessment of affordable housing need..
Overall, the analysis identifies a need for affordable housing; it is clear that provision of new affordable housing is an important and pressing issue in the County. The evidence does however suggest that affordable housing delivery should be maximised where opportunities arise.
The SHMA (2019) therefore indicates a higher annual requirement is necessary to help to address issues of affordability and recommends a minimum requirement of 190 dwellings per annum. An alternative option would be to set the minimum requirement at 160 dwellings per annum as indicated in the SHMA as being a reasonable requirement taking account of the uncertainty given that the market analysis is linked to forecast economic growth. This is the rate which was proposed in the now withdrawn Local Plan. It is closer to the requirement of the adopted Core Strategy (150 per annum) and reflects the average delivery rates over its plan period. It will also help to deliver more affordable homes than Option A below. The Council will undertake an update to the SHMA to support the preparation of the next stage of the Local Plan.
It is appropriate for the Local Plan Issues and Options report to set out a number of options for housing growth for public consultation whilst ensuring compliance to the NPPF. Clearly, the different options for the scale of housing growth will have differential impacts on economic, social and environmental considerations as well as on infrastructure. The following options are put forward for consideration:
Question 11 Options for the scale of housing growth
Which option do you consider to be most appropriate to include in the Rutland Local Plan as the minimum housing requirement?
Option A: Apply Government LHN of 140 dwellings per annum with a contingency of 10%
This would accommodate levels of house building that accord with current Government requirements. It may mean, however, that Rutland will fall short of meeting all affordable housing needs.
Option B : Apply the SHMA housing market analysis of 160 dwellings per annum with 10% contingency as a more detailed assessment of housing needs arising from demographic projections. This would potentially result in most affordable housing needs being met and also would be roughly equivalent to applying the Government LHN of 140 dwellings per annum with a contingency of 25%.
Option C :Apply the higher position from the 2019 SHMA housing market analysis of 190 dwellings per annum with a 10% contingency – this is likely to more fully meet the identified affordable housing needs of the county
Contingency means the additional supply of housing sites which would be required to deliver the minimum requirement as it provides flexibility and choice and allows for the "non-delivery" of some allocated sites.
Question 12
Do you have any alternative suggestions about the housing requirement for Rutland?
Issue 2b: Determining the appropriate location of housing growth
Strategic Objective 2: Delivering sustainable development by determining an appropriate level and location of growth in Rutland, sited in locations where people can access jobs and services, and in delivering wider social and economic outcomes, taking account of environmental considerations.
Paragraph 68 of the National Planning Policy Framework (NPPF) requires that strategic policy-making authorities should have a clear understanding of the land available in their area through the preparation of a strategic housing land availability assessment. From this, planning policies should identify a sufficient supply and mix of sites, taking into account their availability, suitability and likely economic viability. Paragraph 79 of the NPPF sets out that to promote sustainable development in rural areas, housing should be located where it will enhance or maintain the vitality of rural communities. Planning policies should identify opportunities for villages to grow and thrive, especially where this will support local services. Where there are groups of smaller settlements, development in one village may support services in a village nearby.
The NPPF supports the placement of housing in town centres and supports a 'town centre first' approach to planning for 'main town centre uses'. It also now incorporates a specific section about making the best use of land which, amongst other things, expects local plans to achieve significantly higher housing densities in town centres.
Whilst both the town centres in Rutland may have some potential to realise growth, the size of the town centre and the Conservation areas and residential amenity will need to be considered, so this is unlikely to provide many opportunities for housing. Sites will need to be considered around the edge of both towns which are likely to be greenfield sites. There may be scope for sites within the towns as well. The two main towns of the County are also important locations for jobs, thereby providing the opportunity to align housing growth with centres for economic growth.
The settlement hierarchy is an appropriate way to set out the role of settlements and the relative sustainability of settlements. The hierarchy in the adopted Local Plan has six categories as follows:
- Main Town
- Small Town
- Local Service Centres
- Smaller Service Centres
- Restraint Villages
- Countryside
To meet Rutland's local housing and employment need and deliver sustainable development within the County, the Local Plan will review the spatial strategy for Rutland and the Settlement Hierarchy to ensure suitable locations for development in Rutland are identified. An assessment of facilities and services in each village will be undertaken and the overall hierarchy will be reviewed and refreshed in the light of the village services survey, as well as the latest national policy in the NPPF. The settlement hierarchy does not in itself determine the appropriate level of growth a particular settlement can support but does seek to identify the most sustainable places where growth could be directed.
The spatial strategy in the withdrawn Local Plan focussed the majority of new development in the two main towns; a new Garden community; and 10 Local Service Centres (LSCs). The LSCs were identified as villages with sufficient services and facilities to support the allocation of sites for development. A number of settlements were identified a Smaller Villages because they had fewer local services and facilities and were not seen as being appropriate locations for allocations. The methodology for determining which settlements were suitable for allocation was published alongside the withdrawn Local Plan and will need to be reviewed as part of preparing the new local plan. Comments about the methodology should be made using the separate consultation.
It has previously been recognised that land in Rutland on the edge of Stamford could also provide a sustainable location for new development, being adjacent to a market town (albeit in a neighbouring authority's area) with a range of facilities and public transport. This would help to support the sustainable growth of Stamford; in doing so, it was recognised that any development adjacent to Stamford would need to form part of an overall growth strategy for Stamford. This will be considered by South Kesteven District Council through its review of its Local Plan. If this continues to be regarded as a suitable location for development, it would need to be the subject of joint planning between the two authorities.
An allocation is included in the adopted Local Plan for South Kesteven District Council for development at Stamford North, on the basis that any development in Rutland as part of a wider comprehensive urban extension to the north of Stamford would count towards South Kesteven's housing needs rather than Rutland's. The Council has opened up discussions with South Kesteven on the basis that development on the Rutland element of any urban extension to Stamford should count towards Rutland's housing needs and so reduce the requirement for new housing elsewhere in Rutland. The preparation of the new Local Plan for Rutland provides the opportunity to resolve this situation through the development plan system.
The 2020/21 Authority Monitoring Report (AMR) has indicated that the total number of net completions for Rutland is 2522 for the plan period so far (2006 – 2021). This equates to 168 dwellings per annum which is higher than the adopted Core Strategy requirement of a minimum of 150 dwellings per year. The distribution of these completions is as follows:
| Rutland County Council | 2006/7 | 2007/8 | 2008/9 | 2009/10 | 2010/11 | 2011/12 | 2012/13 | 2013/14 | 14/15 | 15/16 | 16/17 | 17/18 | 18/19 | 19/20 | 20/21 | Total |
|---|---|---|---|---|---|---|---|---|---|---|---|---|---|---|---|---|
| Main Towns: Oakham and Uppingham (including Barleythorpe) | 60 | 32 | 76 | 31 | 26 | 11 | 30 | 87 | 166 | 160 | 214 | 208 | 127 | 161 | 119 | 1508 |
|
Percentage Total |
37.97% | 25.20% | 60.32% | 25.83% | 21.49% | 11.96% | 24.00% | 50.88% | 73.78% | 72.73% | 86.29% | 82.87% | 60.19% | 87.50% | 85.00% | 59.87% |
| Local Service Centres | 36 | 42 | 7 | 24 | 15 | 31 | 19 | 15 | 10 | 14 | 18 | 34 | 63 | 7 | 4 | 339 |
|
Percentage Total |
22.78% | 33.07% | 5.56% | 20.00% | 12.40% | 33.70% | 15.20% | 8.77% | 4.44% | 6.36% | 7.26% | 13.55% | 29.86% | 3.80% | 2.86% | 13.46% |
| Other villages | 62 | 53 | 43 | 65 | 80 | 50 | 76 | 69 | 49 | 46 | 16 | 9 | 21 | 16 | 17 | 672 |
|
Percentage Total |
39.24% | 41.73% | 34.13% | 54.17% | 66.12% | 54.35% | 60.80 | 40.35% | 21.78% | 20.91% | 6.45% | 3.59% | 9.95% | 8.70% | 12.14% | 26.68% |
| New Total | 158 | 127 | 126 | 120 | 121 | 92 | 125 | 171 | 225 | 220 | 248 | 251 | 211 | 184 | 140 | 2519 |
Housing completions in recent monitoring periods have not met the balance set as a target potentially due to the impact of the COVID-19 pandemic, however overall, the monitoring indicates the spatial strategy and settlement hierarchy should be reviewed. Over the period 2006 to 2021, approximately 60% of all dwellings were completed in Oakham and Uppingham, which was below Core Strategy Spatial Strategy and Settlement Hierarchy target of 70%. About 13% of all completions occurred in Local Service Centres against an intended target of 20%, with nearly 27% of all dwellings being completed in all other villages against an expected provision of 10% in the Core Strategy. Overall, rates and locations of development vary over the Core Strategy plan period as housing supply has changed as a result of permissions being taken up. Rates of housing development in all the other villages were particularly high in the period 2006-2016.
Paragraph 71 of the NPPF sets out that where an allowance is to be made for windfall sites as part of anticipated supply, there should be compelling evidence that they will provide a reliable source of supply. Any allowance should be realistic having regard to the strategic housing land availability assessment, historic windfall delivery rates and expected future trends.
The Local Plan will seek to update and review the windfall study to help develop appropriate policies to propose sustainable development within the Local Plan.
Paragraph 73 of the NPPF states "that the supply of large numbers of new homes can often be best achieved through planning for larger scale development, such as new settlements or significant extensions to existing villages and towns, provided they are well located and designed, and supported by the necessary infrastructure and facilities (including a genuine choice of transport modes). Working with the support of their communities, and with other authorities if appropriate, strategic policy-making authorities should identify suitable locations for such development where this can help to meet identified needs in a sustainable way. In doing so, they should:
- consider the opportunities presented by existing or planned investment in infrastructure, the area's economic potential and the scope for net environmental gains;
- ensure that their size and location will support a sustainable community, with sufficient access to services and employment opportunities within the development itself (without expecting an unrealistic level of self-containment), or in larger towns to which there is good access;
- set clear expectations for the quality of the places to be created and how this can be maintained (such as by following Garden City principles); and ensure that appropriate tools such as masterplans and design guides or codes are used to secure a variety of well-designed and beautiful homes to meet the needs of different groups in the community;
- make a realistic assessment of likely rates of delivery, given the lead-in times for large scale sites, and identify opportunities for supporting rapid implementation (such as through joint ventures or locally led development corporations); and
- consider whether it is appropriate to establish Green Belt around or adjoining new developments of significant size.
The submitted and now withdrawn Local Plan included a proposal to establish a new community on the site of St. George's Barracks at North Luffenham. In addition, a separate proposal to establish a new community at Woolfox was assessed but determined to be not deliverable or viable prior to the Council decision in February 2020. Should these, or potentially any other proposals to establish a new community in Rutland, be put forward for consideration within the Local Plan the plan will need to consider the option of whether to provide for meeting identified housing, employment and community needs through a new sustainable community (or communities); Any proposal would need to demonstrate that it is sustainable, viable and deliverable and compliant with the NPPF.
Implications for the spatial strategy within the Local Plan
Applying the Government's minimum LHN of 140 dwellings per annum for Rutland with the provision of a 10% buffer over a plan period from 2021 to 2041 would equate to a total housing requirement of 3,080 dwellings. This would be offset by completions since April 2021 and existing commitments through current allocations and permissions.
The table below shows the current adopted spatial distribution of housing as contained within the adopted Core Strategy and applies the same pattern of distribution to the minimum requirement of 3,080 dwellings using the LHN. The Core Strategy provides for 70% of housing taking place in Oakham and Uppingham and 30% taking place across the villages of Rutland (on the basis of 20% in the larger villages defined as LSCs and 10% elsewhere). The distribution in the two towns is on the basis of 80% in Oakham and 20% in Uppingham.
|
Area |
Requirement 2021-41 (140* dpa + 10% buffer) |
Core Strategy distribution |
Commitments at 1st April 2021* |
Completions from April to September 2021* |
Indicative housing supply to deliver the requirement in line with the Core Strategy distribution ** |
|---|---|---|---|---|---|
|
Oakham |
- |
56% = 1,725 |
313 |
41 |
1,371 |
|
Uppingham |
- |
14% = 431 |
30 |
0 |
401 |
|
Larger Villages |
- |
20% = 616 |
54 |
0 |
562 |
|
Other Villages |
- |
10% = 308 |
106 |
3 |
Indicative provision of an additional 199- dwellings assumed to be delivered through infill/windfall in these villages without proposing allocations in these settlements |
|
County Total |
3,080*** |
3,080 |
503 |
44 |
2,533 |
Figure 3: Applying existing Core Strategy spatial strategy housing distribution to current minimum housing requirement
* These figures will be reviewed and updated on a regular basis.
** there is scope for some of this supply to be found through an allowance for windfalls in all settlements provided this allowance is justified. For comparison, the submitted and withdrawn Local Plan included an allowance of 300 windfalls over the plan period 2018-36. This will be updated.
*** no provision has been made regarding the potential development at Stamford North contributing to this requirement for Rutland as there is currently no policy basis for the allocation of this site. It is intended now that any development on the Rutland part of a comprehensive Sustainable Urban Extension to Stamford should count towards Rutland's housing needs and so reduce the requirement for new housing elsewhere in Rutland.
It is appropriate for the Local Plan Issues and Options report to set out a number of options for a relevant and justified spatial strategy to be applied in meeting growth, taking account of the above considerations. At this stage in preparing the Local Plan, relevant options to consider for the spatial strategy would be:
Question 13 Options for the spatial strategy for new housing development
Which option(s) do you consider to be most appropriate to include in the Rutland Local Plan?
Option A: Continuation of the Core Strategy apportionment of growth between the towns (70%) and villages (30%) This would spread planned growth in line with the past spatial strategy.
Option B: Provide a higher proportion of growth in Oakham. This would concentrate more development in the main centre of population in Rutland but would put additional pressure on infrastructure and the local environment.
Option C: Provide a higher proportion of growth at Uppingham This would concentrate more development on the second largest settlement in Rutland but would put additional pressure on infrastructure and the local environment.
Option D: Provide a higher level of growth at Local Service Centres This would propose more development in the larger villages with a range of services and facilities but would put additional pressure on infrastructure and the local environment.
Option E: Provide for meeting growth through a new sustainable community (or communities) This would be dependent on sustainable, viable and deliverable proposals coming forward through the Local Plan. This would ease the pressure of growth for Oakham, Uppingham and Local Service Centres but would put additional pressure on the infrastructure and local environment on the areas surrounding any new settlement(s).
Question 14
If development in Rutland is proposed as part of a sustainable urban extension to Stamford should this count towards Rutland's housing needs and so reduce the requirement for new housing elsewhere in Rutland?
Question 15
Do you have any alternative suggestions for the location of housing growth in Rutland?