Local Plan - Local Waste Needs Assessment
Waste planning in context
1. The National Planning Policy Framework does not specifically address waste matters, detailed waste planning policies are set out in the National Planning Policy for Waste (NPPW). The NPPW is to be read in conjunction with the NPPF, the National Waste Management Plan for England and National Policy Statements (NPS) for waste water and hazardous waste.
2. In relation to the preparation of plans the NPPW requires Waste Planning Authorities (WPAs) to ensure that the planned provision of new capacity and its spatial distribution is based on robust analysis of best available data and information, and an appraisal of options. Spurious precision should be avoided. In addition Local Plans should identify sufficient opportunities to meet the identified needs of their area for the management of waste streams and in doing so:
- drive waste management up the waste hierarchy;
- recognise the need for a mix of types and scale of facilities, and that adequate provision must be made for waste disposal (including for residues from treated wastes);
- identify tonnages and percentages of waste requiring different types of management over the plan period;
- consider the extent to which existing operational facilities would satisfy any identified need;
- consider wider waste management needs; and
- work collaboratively (with other WPA's through the Duty to Cooperate) to provide a suitable network of facilities to deliver sustainable waste management.
3. Local Plans, should also identify sites and/or areas for waste management facilities and in doing so:
- identify the broad type(s) of facility that would be appropriate;
- take account of the proximity principle (particularly regarding disposal and the recovery of municipal waste) and recognise the role of catchment areas in securing economic viability;
- consider opportunities for on-site waste management;
- consider a broad range of locations including industrial sites, and consider opportunities to co-locate waste management facilities together and with complementary activities; and
- give priority to the re-use of previously-developed land, sites identified for employment uses, and redundant agricultural and forestry buildings and their curtilages.
4. The NPPW also sets out criteria against which the identification of sites/areas for waste management facilities should be assessed.
5. In relation to the wider policy context the Waste Framework Directive (2008/98/EC) sets out the concept of the waste hierarchy (prevention, preparation for re-use, recycling, other recovery e.g. energy recovery and disposal), proximity principle and self-sufficiency. It also requires that waste is recovered or disposed of without endangering human health or causing harm to the environment. Article 28 of the Waste Framework Directive (concerning Waste Management Plans) requires an assessment of how the current waste management and disposal capacities will shift over time in response to the closure of existing waste management and disposal facilities and the need for additional waste installation infrastructure.
6. The UK Waste Regulations 2011 transposes the Waste Framework Directive to UK law.
7. The Landfill Directive (99/31/EEC) aims to prevent or reduce as far as possible negative effects on the environment from the landfilling of waste and setting targets for the reduction of biodegradable municipal waste going to landfill.
The adopted Local Plan
8. Waste management and disposal is currently addressed through the adopted Core Strategy and Site Allocations DPDs under several policies, the key policies being Policy CS25 - Waste management and disposal, Policy SP4 - Sites for waste management and disposal and Policy SP28 - Waste-related development. These three policies set out the spatial strategy, indicative capacity requirements, site allocations and development control principles for waste management and disposal in Rutland up to 2026.
9. The current policy approach recognises that Rutland is not a significant producer in terms of waste arisings and in its capacity to facilitate development of waste management and disposal facilities. As such the focus is on the provision of preliminary and supporting facilities and helping to deliver regional self-sufficiency. The plan also supports incorporation of waste minimisation and management with other forms of development in a manner that reflects the broader spatial strategy and hierarchy. In this way the plan considers the need for waste management facilities alongside other spatial planning concerns. This approach is consistent with national policy and guidance.
The Local Plan
10. As the WPA the County Council must plan for the management (and disposal) of all controlled waste streams produced within Rutland including: municipal waste; commercial and industrial (C&I) waste; construction, demolition and excavation (CD&E) waste; hazardous waste; and radioactive wastes.
11. Local plans must be kept up-to-date, for waste planning matters this means providing an up-to-date picture of the amount of waste we produce as well as our future arisings and management (and disposal) needs. These core elements, and other policies, need to be brought more closely in line with the NPPW. The adopted waste arisings and indicative capacity requirements were based on the best available data and policy requirements (and targets) at the time. However, time has moved on with new data and information published as well as changes in the policy landscape. The Local Plan is being rolled forward to 2041 (from 2026). Simply rolling the existing forecasts forward would not prove sound as these do not capture recently released data and other information or conform to current policy requirements.
12. This Local Waste Need Assessment has been prepared to inform the plan-making process and take account of current policy requirements (including targets) as well as data and other information.
13. Where possible waste arisings will be updated on an annual basis through the Annual Monitoring Report (including the amount of waste recycled, recovered or disposed of, permitted capacity figures, take-up in allocated sites and areas).
How much waste does Rutland produce?
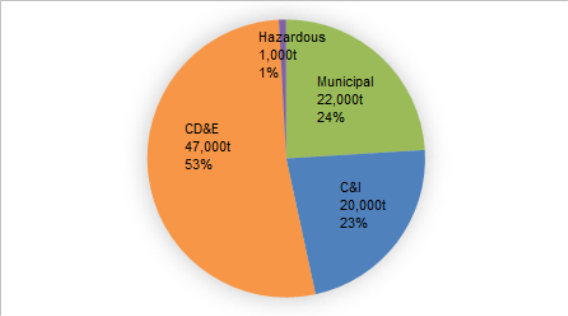
14. It is estimated that in 2021 Rutland produced just under 90,000 tonnes (t) of various types of waste, this includes: 22,000t municipal waste (24%); 20,000t C&I waste (23%); 47,000t CD&E waste (53%); and just under 1,000t hazardous waste (1%), see figure below. Projections indicated that waste arisings could increase to 118,000t by the end of the plan period (2041).
Figure 1: Waste arisings for Rutland 2021 (tonnes)
15. Rutland does not produce low-level radioactive waste (LLW) from the nuclear industry. A very small amount (23m3 or 115kg in 2007/08) of LLW from the non-nuclear industry (DECC 2008) is produced from the Leicestershire and Rutland county areas.
16. In addition, the county also produces agricultural waste and wastewater.
How is waste currently managed?
17. The majority of waste produced in Rutland is exported to surrounding authorities where it undergoes processing in preparation for recycling and reuse (including composting and inert recycling) or is otherwise treated or disposed of to landfill. Such arrangements are subject to commercial contracts that are largely outside the scope of the plan-making process.
18. In line with the Duty to Cooperate (DtC), strategic waste movements were identified using the EA Waste Interrogator database and local authority contracts and records. Strategic movements were defined relative to Rutland and included the following:
- Export of waste for disposal to landfill. Reasoning: Rutland does not have any landfill sites and so is entirely reliant on capacity provided in other WPA areas and this pattern will continue over the plan period. In addition, landfill void space is limited and sites cannot operate indefinitely.
- Export of waste for treatment over 1,500 tonnes per annum (tpa) to an individual advanced treatment facility (e.g. energy to waste). Reasoning: Rutland's waste production is relatively small and so its ability to support larger scale treatment facilities is reduced, as such it is likely to continue to be reliant on capacity provided in other WPA areas. Movement over 1,500tpa would represent roughly 10% of all waste currently available for treatment.
- Export of hazardous waste for recovery or treatment over 100tpa to an individual facility. Reasoning: Rutland's waste production is relatively small and so its ability to support specialised treatment facilities (e.g. those that manage hazardous wastes) is reduced, as such it is likely to continue to be reliant on capacity provided in other WPA areas. Movement over 100tpa would represent roughly 10% of all hazardous waste produced in the county.
19. As a result, several WPAs and waste management/disposal sites were identified, as detailed below:
Northamptonshire
- Rushton Landfill Site, non-hazardous landfill
- Wakerley Quarry, inert recovery
- Ringstead Quarry, inert recovery
- Collyweston Quarry, inert landfill
Lincolnshire
- New Earth Solutions (west) Composting Site, composting
- South Witham Quarry, inert treatment
Peterborough
- Eye North Eastern, non-hazardous landfill
- Thornhaugh, non-hazardous landfill (SNRHW)
- Dogsthorpe, non-hazardous landfill (SNRHW)
Cambridgeshire
- Mepal Landfill Southern Extension, inert landfill
- Witcham Meadlands Landfill, non-hazardous landfill (SNRHW)
Nottingham City UA
- Eastcroft waste to energy, Nottingham
20. No issues of concern were identified regarding strategic waste movements as a result of the DtC survey. Information was provided in relation to the sites listed above, Rushton Landfill has commenced site restoration and Eastcroft is only permitted to receive a certain number of tonnes from outside the Nottinghamshire boundary.
21. Strategic waste movements from Lincolnshire County Council and Cambridgeshire County Council into Rutland were identified regarding Woolfox Quarry - inert landfill supporting restoration of an operational quarry site. Such movement are in line with adopted policy and so the Council does not consider that there are any strategic planning matters that would affect the continuation of such movements.
22. In addition, other WPAs including neighbouring authorities where strategic movements were not identified, will be consulted through the normal plan-making process and any strategic issues that arise will be given due consideration.
23. At this stage no specific cross boundary issues have been identified however the Council will continue to co-operate with relevant authorities in relation to strategic waste planning matters.
Waste arisings over the plan period
24. In order to plan for provision of new capacity it is first necessary to project waste arisings over the plan period. This has been done separately for each of the waste streams (municipal, C&I, CD&E and hazardous waste) due to the different factors that drive waste arisings and affect projections. Waste arising projections for individual streams are detailed below.
25. Data from projections and forecasts is reported as rounded to the nearest 1,000t to avoid spurious precision; the exception being for municipal and hazardous waste, which are rounded to the nearest 500t, to indicate where there has been an incremental change over the plan period of up to 500t that would not otherwise be detected if reported at 1,000t. This is because data on municipal waste is more accurate and so projections have a higher level of accuracy. Hazardous waste arisings for Rutland total around 1,000tpa and so it was necessary to round the data to a lower level (i.e. nearest 500t) to capture the levels of management methods at a more representative scale. Data for municipal waste is reported for financial years, whereas data reported through industry returns and surveys for other waste streams are generally for calendar years. For the purpose of the plan-making process the data will be taken to be on calendar year basis, that is data for the year 2020/21 will be taken as 2021; doing so will not significantly alter the results as three-quarters of the 2020/21 dataset is captured in 2020.
Municipal waste
26. Data used to project municipal waste arisings and forecast management methods and capacity requirements were taken from local authority records, Waste Dataflow database and Local Authority Collected Waste Management Statistics. The municipal waste projections incorporate increases in dwelling stock (i.e. increase in housing).
27. The forecasts for management of waste incorporate European, national (UK) and local (Municipal Waste Management and Street Scene Strategy 2022-2035) targets. The EU Circular Economy identifies targets for an increase in recycling rates to 65% and a decrease in disposal to 10% by 2030 (of municipal waste). Current local recycling rates are at 57% and so an increase to 65% would not be unachievable over the plan period however may be impacted on by recovery rates, which currently sit at 46%, with the disposal rate at less than 1%. Rutland has a contract with FCC Eastcroft Energy Recovery Facility in Nottingham to divert 8,500tpa from landfill to recovery (commenced April 2014). It is estimated that around 1,000t of residual waste may be produced from treatment processes.
28. Approximately 22,000t of municipal waste arose in Rutland 2021. It is anticipated that municipal waste arisings will increase slightly (26,000t by 2041). Projected arising and management methods over the plan period (at five-year intervals) are detailed in Table 1 below.
29. Assumptions made in projecting waste arisings for the municipal waste stream include:
- Annual growth rate reflects housing projections (dwellings completions and projections) with an averaged waste arisings per dwelling applied to forecast future arisings.
- Recycling / composting rates will not decrease.
- Recovery / diversion of waste from landfill will continue as per the current contract (8,500tpa).
Table 1: Municipal waste arisings and management up to 2041 (thousand tonnes)
|
2021 |
2026 |
2031 |
2036 |
2041 |
|
|
Total municipal waste |
21.5 |
22.5 |
24 |
25 |
26 |
Waste hierarchy level and broad management method |
|||||
Preparation for reuse and recycling |
|||||
|
Materials recycling |
6.5 |
7 |
8 |
8.5 |
8.5 |
|
Composting |
6 |
6.5 |
7.5 |
7.5 |
8 |
Treatment and other forms of recovery |
|||||
|
Treatment and energy recovery |
9 |
8.5 |
8.5 |
8.5 |
9 |
Disposal |
|||||
|
Non-hazardous landfill (including SNRHW) |
0 |
0 |
0 |
0 |
0 |
* Management rates for 2021 reflect waste arisings reported through Waste Dataflow for the period 2021/22.
Commercial and industrial waste
30. Data used to project C&I arisings and forecast management methods and capacity requirements was derived from the following sources:
- DEFRA UK statistics on Waste – 2021
- DEFRA C&I waste arisings methodology revision for England 2018
- EA Waste Data Interrogator and Incinerator Returns
- Employee data – NOMIS Employees by sector for Rutland, Leicestershire, East Midlands and England
- C&I growth profile – Cambridge Econometrics 2016 East of England forecasting model 2016 baseline, Total GVA Rutland
31. The above sources were found to be the most recent data/information releases. Waste data for the C&I stream is collected through national surveys; no recent local data for C&I waste exists or is currently collected.
32. C&I waste is grouped with municipal waste and report jointly as "household, industrial and commercial (HIC) waste through the EA Waste Data Interrogator (EA WDI). There is potential for over estimation where municipal waste is included and where waste is handled at intermediate facilities such as transfer stations. As such it is necessary to cleanse the data extracted from these databases. This was done by removing out of scope waste through analysis of the European Waste Codes (EWC), in particular Chapter 20 – Municipal wastes, and wastes that passed through an intermediate facility (including non-hazardous and hazardous waste transfer stations). The reason for removing intermediate facilities is that the waste would be transferred on for further processing and/or treatment and potentially resulting in double counting. Where waste has been recorded through intermediate facilities, either identified as transfer/treatment in the WDI or permitted for transfer and materials recycling by the WPA, such materials were captured under materials recycled at a rate of 25%.
33. A similar practise was also undertaken to consider consignments recorded in the WDI as "not codeable" East Midlands and not codeable Leicestershire. To assign a proportion of the C&I wastes to Rutland, total waste tonnage was apportioned from a regional to local level (i.e. East Midlands down to Rutland) based on the percentage of employees within commercial and industrial sectors.
34. It is also possible that some C&I waste arisings are recorded under EWC chapter 20 municipal. In order to identify this potential component, the total municipal waste arising were subtracted from the total of EWC 20 waste with the surplus then added to the total.
35. To include these potential unseen tonnages, the C&I waste total from the WDI was added to the not codeable data and the surplus municipal, this total was compared with the C&I figure from the WDI and an average taken. For the purposed of sensitivity testing, the latest C&I arisings for England were used with local estimate being produced by applying the percentage of total employee count represented within Rutland. These national estimates are not designed to be drilled down to WPA level so may not form a precise representation, however, does provide a broad indication of the scale that might be expected. To extrapolate the data forward the Gross Value Added (GVA) by authority area was applied and allowed estimated figures until 2041 to be forecast. Forecasts of management methods were based on maximising recovery of wastes in order to facilitate driving waste up the waste management hierarchy. Hazardous wastes were removed as these are accounted for through the hazardous waste stream. The EU Circular Economy package includes a target of recycling 75% of packing waste by 2030. Key recyclable streams are estimated to make up 21% of C&I waste. The approach applied to determine management capacity requirements for C&I waste (based on maximising recovery) satisfies the EU target, resulting in a total recovery rate of 95% by 2030.
36. No upwards adjustment has been made to the C&I forecasts with respect to housing sites as the development will not result in an increase in employment land from that set out in the Strategic Housing and Employment Land Availability Assessments.
37. It is estimated that approximately 22,000t of C&I waste arose in Rutland 2021, it is anticipated that arisings will increase with arisings for 2041 estimated at 30,000t. Projected arising and management methods over the plan period (at five-year intervals) are detailed in Table 2 below.
Table 2: C&I waste arisings and management up to 2041(thousand tonnes)
|
2021 |
2026 |
2031 |
2036 |
2041 |
||
|
Total C&I waste |
20 |
22 |
24 |
26.5 |
29.5 |
|
Waste hierarchy level and broad management method |
||||||
Preparation for reuse and recycling |
||||||
|
Materials recycling |
17 |
16.5 |
18 |
20 |
22 |
|
|
Composting |
<1 |
<1 |
<1 |
<1 |
<1 |
|
Treatment and other forms of recovery |
||||||
|
Treatment and energy recovery |
3 |
4 |
5 |
5.5 |
6 |
|
Disposal |
||||||
|
Non-hazardous landfill |
<1 |
1 |
1 |
1 |
1.5 |
|
|
Non-hazardous landfill |
<1 |
1 |
1 |
1 |
1.5 |
|
|
Non-hazardous landfill (SNRHW) |
<1 |
<1 |
<1 |
<1 |
<1 |
|
|
Disposal via incineration – no energy recovery |
<1 |
<1 |
<1 |
<1 |
<1 |
|
38. Assumptions made in projecting waste arisings for the C&I stream include:
- Apportioning waste based on employee numbers provides a representative fraction of waste arisings.
- The breakdown of waste types and fates identified through national surveys is transferrable to Rutland.
- Waste arisings growth is linked to total GVA growth.
- A three-year average indicates emerging trends and best reflects local circumstances.
Construction, demolition and excavation waste
39. Data used to project CD&E arisings and forecast management methods and capacity requirements was derived from the following sources:
- DEFRA December 2018 UK statistics on waste
- EA Waste Data Interrogator database 2016 – 2021
- MHCLG Housing Supply: Net additional dwellings 2001/02 to 2018/19
- Rutland County Council 2017 Strategic Housing Market Assessment (SHMA) Update 2020
40. National estimates for construction and demolition and excavation (C&D) waste arisings are set out in the DEFRA 2014, 2016 and 2018 UK statistics on waste (Table 7 and 12[1]). Estimates for CD&E (UK statistics on waste) that include dredging waste can be amended to remove dredging spoils (EWC 12.7) for the relevant year (using the Total Generation of waste split by NACE economic activity and EWC State waste material table as detailed in the UK statistics on waste dataset). Arisings for Rutland were determined as a percentage of the total estimated CD&E arisings for England based on the proportion of construction activity (dwelling completions) attributed to Rutland (between 0.13% and 0.08%). This method produced a figure of 98,000t for 2018. This figure was extrapolated forward using growth factors based on dwelling completions for the period 2016 to 2021 and forecast housing supply figures from 2022 onwards. The outcome of which indicated that around 86,000t of CD&E was generated in 2022 increasing to around 90,000t in 2024.
41. CD&E waste "as managed" is reported through the EA WDI, around 60,000t has been reported as being generated from Rutland over the last few years. Of this around 45,000t was deposited to land as part of restoration works at quarries within the county and the remainder was mostly recovered (through recycling and/or treatment processes). This is higher than the rate identified for inert recovery/fill using the national management rates, however, where such increases contribute towards the overall recovery rate and divert waste from disposal to landfill there is not considered to be any conflict. It is widely acknowledged that a significant quantity of CD&E waste is recycled and/or re-used onsite and on registered exempt sites; this unseen capacity is not captured through the EA WDI database and so this dataset may underestimate arisings.
42. The estimate of 90,000tpa produced from the national figures are higher than those reported through the EA WDI however the difference may reflect the unseen capacity, giving a more rounded picture of arisings. For the purpose of the plan-making process and identifying future management needs this unseen capacity has been taken to be the difference between the national recovery rate and that reported through the EA WDI, around 28,000tpa, and is taken to continue to be available throughout the plan period.
43. The above review of available data demonstrates that data on CD&E waste is relatively poor at a sub-regional level; this means that there may be insufficient basis for making confident forward projects of arisings. In addition, the level of construction within Rutland is not likely to be any greater in the future than experienced previously (including during periods of economic growth), for these reasons it may be best to take a conservative approach. Given this, the assumption that net arisings of CD&E waste will remain constant over time may be the most suitable approach and may reflect in part the impact of the landfill tax and the Aggregates Levy, which will encourage the re-use of CD&E waste on site in order to avoid additional disposal and raw material costs. Due to reduced confidence in forward projections of CD&E arisings a no growth scenario has been applied.
44. It is estimated that approximately 90,000t of CD&E waste is currently generated in Rutland, it is anticipated that arisings will remain the same over the plan period. Of this, around 28,000tpa is recovered either onsite or at exempt sites, it is assumed that this unseen capacity will to continue to be available throughout the plan period.
45. Projected arising and management methods over the plan period (at five-year intervals) are detailed in Table 3 below.
Table 3: CD&E waste arisings and management up to 2041 (thousand tonnes)
|
2021 |
2026 |
2031 |
2035 |
2041 |
|
|
Total as managed CD&E waste |
47 |
61 |
61 |
61 |
61 |
Waste hierarchy level and broad management method |
|||||
Preparation for reuse and recycling |
|||||
|
Materials recycling |
<1 |
2 |
3 |
3 |
3 |
|
Composting |
1 |
1 |
1.5 |
1.5 |
1.5 |
|
Inert recycling |
<1 |
<1 |
<1 |
<1 |
<1 |
Treatment and other forms of recovery |
|||||
|
Treatment and energy recovery |
1 |
7 |
11 |
11 |
11 |
|
Soil treatment |
<1 |
<1 |
<1 |
<1 |
<1 |
|
Inert recovery |
<1 |
23 |
43 |
43 |
43 |
Disposal |
|||||
|
Inert landfill |
40 |
27 |
3 |
3 |
3 |
|
Non-hazardous landfill |
1 |
<1 |
<1 |
<1 |
<1 |
|
Non-hazardous landfill |
<1 |
<1 |
<1 |
<1 |
<1 |
|
Non-hazardous landfill (SNRHW) |
<1 |
<1 |
<1 |
<1 |
<1 |
* Management rates for 2021 reflect waste arisings 'as managed' and reported through the EA WDI 2021.
46. Inert recovery includes deposit of inert waste associated with the restoration of permitted mineral extraction sites, resulting in beneficial outcomes. For the purpose of the WNA targets are identified for CD&E waste of: for EWC 170504 - 95% recovery and a maximum 5% disposal to landfill by 2030; and for other wastes (excluding EWC 170504 wastes) - 98% recovery and a maximum 2% disposal to landfill by 2030.
47. Assumptions made in projecting waste arisings for the CD&E stream include:
- Growth in CD&E is tied to construction and/or demolition projects and so does not continually grow year on year.
- Apportioning waste based on dwelling completions and housing growth rates provides a representative fraction of waste arisings.
- The breakdown of waste types and management rates identified through national surveys is transferrable to Rutland.
- Net arisings of CD&E waste will remain constant over time.
- The unseen management capacity mainly constitutes reuse and recycling capacity and will continue to be available throughout the plan period.
Hazardous waste
48. Data on hazardous wastes is relatively precise, reported through the EA's Hazardous Waste Data Interrogator (EA HWDI) database, which holds information on the arisings, movements and management. This database forms the most reliable source for hazardous waste data arisings and has been used for identifying arisings and management rates. Outlier data was subtracted as such figures were considered to likely be related to a once-off project and hence would not be reflective of ongoing patterns.
49. The production of hazardous waste is linked to commercial and industrial business activities, and so is likely to have similar growth patterns. For this reason, hazardous waste has been projected forward using the same growth profile for C&I waste.
50. It is estimated that just under 1,000t of hazardous waste arose in Rutland 2021, it is anticipated that arisings will increase (very) slightly over the plan period. Projected arising and management methods over the plan period (at five-year intervals) are detailed in Table 4 below.
Table 4: Hazardous waste arisings and management up to 2041 (thousand tonnes)
|
2021 |
2026 |
2031 |
2036 |
2041 |
|
|
Total hazardous waste |
1 |
1 |
1 |
1 |
1 |
Waste hierarchy level and broad management method |
|||||
Recovery |
|||||
|
Recovery and treatment |
0.5 |
1 |
1 |
1 |
1 |
Disposal |
|||||
|
Hazardous landfill |
<0.5 |
<0.5 |
<0.5 |
<0.5 |
<0.5 |
|
Disposal via incineration – no energy recovery |
0 |
0 |
0 |
0 |
0 |
51. Assumptions made in projecting waste arisings for hazardous waste include:
- Hazardous waste is linked to commercial and industrial business activities and shares the same growth profile.
- Current management rates are reflective of future rates.
Agricultural wastes
52. Little is known of waste arisings within the agricultural sector. The majority of agricultural wastes are not classified as controlled wastes, however non-natural agricultural wastes are included under the WFD. This component accounts for a very small amount (<1%) and is thought to be managed via the use of household collection or civic amenity sites and transfer to others (contractors). As such the non-natural component of agricultural waste is likely to be captured under either trade waste received at civic amenity sites or within the C&I waste streams where transferred to others.
53. Given the uncertainty regarding both arisings data and management a constant level of waste arisings has been assumed.
Low level radioactive waste
54. Radioactive wastes are produced in the UK as a result of the generation of electricity in nuclear power stations and from the associated production and processing of the nuclear fuel (including decommissioning of plant), from the use of radioactive materials in industry, from the extraction of naturally occurring radioactive materials (NORM), medicine and research, and from military nuclear programmes. In the UK, the majority of radioactive waste is from the decommissioning of nuclear power reactors.It is essential that all radioactive wastes and materials be safely and appropriately managed in ways that pose no unacceptable risks to people or the environment.
55. Radioactive waste is divided into categories according to how much radioactivity it contains and the heat that this radioactivity produces, the main categories include: High Level Waste (HLW), Intermediate Level Waste (ILW) and Low Level Waste (LLW).
56. LLW is mainly comprised of building rubble, soil and steel items such as framework, pipework and reinforcement from the dismantling and demolition of nuclear reactors and other nuclear facilities and the clean-up of nuclear sites. However, at the present time most LLW is from the operation of nuclear facilities, and is mainly paper, plastics and scrap metal items. LLW can be disposed of at near surface facilities. Waste at the lower activity range of (LLW) may not require the level of engineering and containment provided by a Low Level Waste Repository and could undergo treatment or disposed of via alternative routes such as disposal at an existing landfill, including a non-hazardous landfill. ILW and HLW are not suitable to be disposed of in the same way as LLW.
57. Rutland does not produce LLW from the nuclear industry. A very small amount (23m3 or 115kg in 2007/08) of LLW from the non-nuclear industry (DECC 2008) was produced from the Leicestershire-Rutland sub-region for the reporting year 2007. Although dated this is the best available information on radioactive waste arisings from the non-nuclear industry. The Nuclear Decommissioning Authority (NDA) 2022 Inventory does not identify any radioactive waste produced within Rutland. The Inventory is updated every three years.
Waste movements
58. Rutland's waste management capacity is limited and there are no non-hazardous landfills in the county, this means that the majority of waste produced in Rutland is exported to other authority areas for management and disposal.
59. The EA WDI provides a general idea of waste movements. Data returned from the EA WDI indicates that around 220,000tpa of waste was managed and/or disposed of in Rutland in 2021; around 13% of which can be attributed to Rutland. However approximately 75% of the total waste can be assigned to Ketton.
60. Waste imported to Rutland is predominantly inert waste that is disposed of at operational mineral extraction sites in line with restoration works, the main origins of which in recent years have been Lincolnshire and Cambridgeshire. Some smaller movements into Rutland also occur from surrounding authorities in preparation for reuse and recycling. In addition, Ketton uses refuse derive fuel (RDF) and this is received from a number of authorities across the country but officially this is not classified as waste as it has already been processed into fuel pellets.
61. The remaining waste produced in Rutland (some 54,000+tpa) is exported for management and/or disposal. WPAs recorded as receiving waste from Rutland are Lancashire, Greater Manchester, Shropshire, Worcestershire, Staffordshire, West Midlands, West Yorkshire, Warwickshire, Derbyshire, South Yorkshire, Tees Valley, North Yorkshire, Leicestershire, Nottinghamshire, North Northamptonshire, West Northamptonshire, Lincolnshire, Buckinghamshire, Bedfordshire, Cambridgeshire, Norfolk and Kent.
62. Overall Rutland is a net exporter of waste and this pattern is likely to continue, however the plan seeks to reduce Rutland's reliance on other WPAs by facilitating delivery of increased capacity particularly for small scale preliminary facilities. The plan also recognises that viability for a small-scale advanced treatment facility may increase over the plan period and supports such development where in line with relevant Local Plan policies.
Rutland's existing waste management capacity
63. Waste management facilities in Rutland include one waste transfer station, two civic amenity sites, 22 'bring' recycling sites, one metal recycling facility and three inert recovery sites (associated with the restoration of a quarries). Ketton cement works is permitted to utilise alternative fuels, which includes waste derived fuels (currently sourced from a number of WPAs).
64. The estimated available capacity of facilities within Rutland in 2021 is 6,500tpa of metal recycling. Approximately 4Mt of void will be available over the plan period for infilling of inert waste for restoration purposes. The civic amenity and waste transfer sites are intermediate facilities that provide a supporting function and have a combined capacity of around 12,000tpa.
65. It should be noted that inert wastes can be recycled or re-used onsite and on registered exempt sites (e.g. as an engineering material in site road-making or as a restoration and cover material); it has been assumed that this will continue to occur.
66. Data returned from the EA WDI indicates an operational capacity of around 65,000tpa the majority (59%) of this is attributed to inert fill (restoration of quarries), with the remainder attributed to intermediate facilities and metal recycling. In excess of 100,000tpa is also being used at Ketton cement works. This site is permitted to utilise alternative fuels which includes waste derived fuels.
67. Permitted and actual or operational capacity can vary significantly; this is due to a range of factors including market drivers and operational efficiencies. Where available, returns for individual sites were collated from EA databases for the period 2017 to 2021. The highest capacity over this five-year period has been taken as the estimated existing capacity for the site and applied over the remaining period.
68. Consideration was given to how the current waste management and disposal capacities will shift over time in response to the closure of existing waste management and disposal facilities and the need for additional waste installation infrastructure. In lieu of information regarding planned closures the permitted end date has been applied in determining how capacity will fluctuate over the plan period and the resulting indicative capacity gaps (Table 5).
Future capacity requirements
69. Waste arisings will increase over the plan period (estimated at 118,000t by 2041); this will in turn require increased waste management and disposal capacity. The table below identifies the existing arisings and capacity and compares this with future requirements. The capacity gap is the difference between the existing capacity and future requirements. The capacity gap can be met either by an increase in capacity at existing sites or development of new sites where compliant with the Local Plan.
Table 5: Comparison of current and future waste management and disposal requirements (thousand tonnes per annum)
|
Waste hierarchy level |
Broad management method |
2021 |
2026 |
2031 |
2036 |
2041 |
|
|
Prep for re-use & recycling |
Materials recycling |
Forecast arisings |
24 |
25 |
29 |
31 |
34 |
|
Existing Capacity |
7 |
7 |
7 |
7 |
7 |
||
|
Capacity Gap |
-17 |
-19 |
-23 |
-25 |
-27 |
||
|
Composting & other biological (no energy recovery) |
Forecast arisings |
7 |
8 |
9 |
9 |
9 |
|
|
Existing Capacity |
0 |
0 |
0 |
0 |
0 |
||
|
Capacity Gap |
-7 |
-8 |
-9 |
-9 |
-9 |
||
|
Inert recycling |
Forecast arisings |
<1 |
<1 |
<1 |
<1 |
<1 |
|
|
Existing Capacity |
0 |
0 |
0 |
0 |
0 |
||
|
Capacity Gap |
-<1 |
-<1 |
-<1 |
-<1 |
-<1 |
||
|
Other recovery |
Other treatment & recovery (incl wood waste EfW) |
Forecast arisings |
13 |
20 |
24 |
25 |
26 |
|
Existing Capacity[2] |
0 |
0 |
0 |
0 |
0 |
||
|
Capacity Gap |
-13 |
-20 |
-24 |
-25 |
-26 |
||
|
Soil treatment / bioremediation |
Forecast arisings |
<1 |
<1 |
<1 |
<1 |
<1 |
|
|
Existing Capacity |
0 |
0 |
0 |
0 |
0 |
||
|
Capacity Gap |
-<1 |
-<1 |
-<1 |
-<1 |
-<1 |
||
|
Inert recovery (includes restoration of permitted mineral extraction sites) |
Forecast arisings |
<1 |
24 |
43 |
43 |
43 |
|
|
Existing Capacity |
117 |
252 |
217 |
100 |
100 |
||
|
Capacity Gap |
117 |
229 |
174 |
57 |
57 |
||
|
Hazardous recovery & treatment |
Forecast arisings |
<1 |
1 |
1 |
1 |
1 |
|
|
Existing Capacity |
0 |
0 |
0 |
0 |
0 |
||
|
Capacity Gap |
-<1 |
-1 |
-1 |
-1 |
-1 |
||
|
Disposal |
Total non-hazardous (including SNRHW) |
Forecast arisings |
1 |
2 |
1 |
1 |
1 |
|
Existing Capacity |
0 |
0 |
0 |
0 |
0 |
||
|
Capacity Gap |
-1 |
-2 |
-1 |
-1 |
-1 |
||
|
Inert landfill |
Forecast arisings |
40 |
27 |
3 |
3 |
3 |
|
|
Existing Capacity |
0 |
0 |
0 |
0 |
0 |
||
|
Capacity Gap |
-40 |
-27 |
-3 |
-3 |
-3 |
70. The revised indicative capacity requirements are similar to those set out in the Core Strategy DPD and are generally still within the identified range. This is due to recently released data, revised targets and information providing an updated view of arisings and emerging trends which indicate that overall (nationally) waste arisings and growth rates may be lower than previously thought.
The need for additional capacity/facilities
71. In line with the policy approach of focussing on preliminary and supporting facilities by the end of the plan period it is estimated that there is a potential requirement for: one or two small-scale materials recycling facilities plus either additional capacity at the existing civic amenity sites or an additional site(s) as required; one small scale composting or anaerobic digestion facility.
72. The existing contract for municipal waste treatment reduces the future advanced treatment requirements by 8,500tpa, leaving around 13,500tpa; this is currently likely to be insufficient to support development of a treatment facility. As such the export of waste for advanced treatment (e.g. Energy from Waste) and disposal is likely to continue, however, the viability of such technologies (at a small-scale) may increase over the plan period or where the facility is ancillary to an industrial operation and used to produce fuel or energy, as such the plan enables sites to come forward where compliant with Local Plan policies.
73. The plan allocates one site, Ketton, for waste management. Forecasts indicate that around three additional facilities (depending on scale) could be required by the end of the plan period to deliver the additional capacity requirements for preparing for reuse and recycling, and biological processing. Unallocated sites are able to come forward where in line with the spatial strategy and development criteria.
74. The plan sets a preference for the deposit of inert waste to land as a recovery operation where tied to the restoration of permitted or allocated mineral extraction sites. The current estimated void space of existing quarries is more than arisings hence it is unlikely that additional inert recovery sites will be required during the plan period that are not associated with the restoration of permitted or allocated mineral extraction site.
75. The adopted plan states that Rutland is not considered an appropriate area to accommodate large scale advanced treatment facilities, new landfill site(s), hazardous waste management facilities or inert disposal not associated with restoration of permitted or allocated mineral extraction site. There have been no changes in local circumstance or national policy that warrants amendment to this policy approach.
[1] Note C&D estimates in Table 7 exclude excavation wastes.
[2] Ketton receives RDF imported in to Rutland, at present Rutland does not have any producers of RDF fuels therefore the capacity at Ketton has been excluded from the totals.